
Game analysis
From the imported .dvw file to readable indicators: how points were won and lost, in which rotations and situations, always with the sample behind every number.
- Web app available now at www.volleycontrolcenter.app.
- iPhone and Android version 2.2.0 submitted to the stores and awaiting approval: the features appear once the app is updated.
Some new labels may still appear in Italian in the app: the Italian name is shown in brackets the first time.
What you need and where it opens
Game analysis uses the actions contained in imported .dvw files, the scout files exported by compatible software such as Ace Evolution or Data Volley. The VCC live box score records points but not the full rally sequence, so it isn't enough for these analyses.
- Import the match .dvw file from Statistics or from the Match page, matching the file's numbers with roster athletes.
- Open More → Statistics and choose Total (Totale) or Selected matches (Singole gare), selecting one or more games.
- From the report tap Game analysis (Analisi del gioco): your selection is kept.
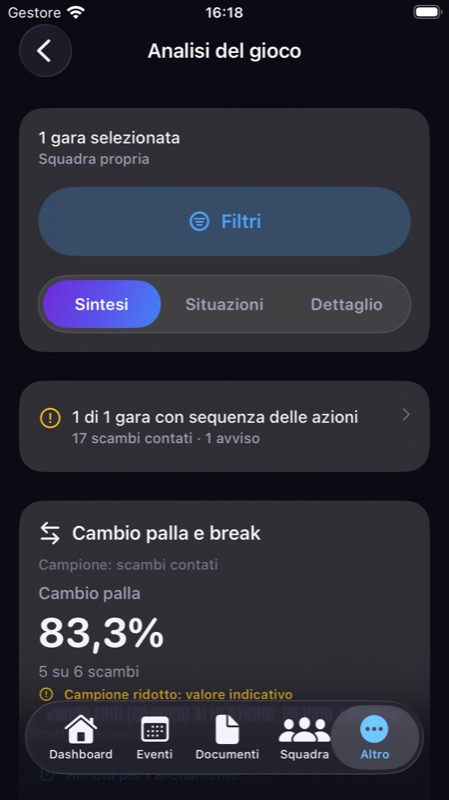
Overview, Situations and Detail
The analysis has three depth levels. Where it makes sense you can filter by team, set, rotation and athlete; indicators that remain team-level say so.
| Level | What it's for |
|---|---|
| Overview (Sintesi) | The picture of the selection: where points won and lost come from (attack, ace, block, recorded errors, unattributed points), side-out, break and first attack. |
| Situations (Situazioni) | Comparison by rotation, attack type, serve-reception and set flow. |
| Detail (Dettaglio) | The rallies behind every number. At most 10 matches can be examined per request; with more games the overview stays available. |
A point's cause is shown only when it's consistent with the point recorded in the rally; otherwise the point stays "unattributed" instead of being assigned at random.
Side-out, break and first attack
Three different indicators, each with its visible denominator:
| Indicator | What it counts |
|---|---|
| Side-out (Cambio palla) | Rallies won when the opponent serves, out of all reception rallies. It includes points from the opponent's serve errors. |
| Break | Rallies won when you serve, out of all your serves. Your own service errors are included in the denominator. |
| First attack (Primo attacco) | Success of the first attack after reception, out of recorded first attacks. |
Rotations P1–P6
The six rotations are compared on the same 0–100 scale, with counts and rally detail. When the sample is small, the app says so. "No rallies in this rotation" and "zero rallies won" are different states and are shown differently.
Attack and recorded distribution
Attacks are split by situation:
- after reception (first possession);
- transition, i.e. after a dig or free ball;
- unknown situation, when the file doesn't allow it to be determined.
For each you see attempts, kills, errors and blocked attacks. Efficiency is calculated as:
Efficiency = (kills − errors − blocked) ÷ attempts
Worked example: 10 attacks with 6 kills, 1 error and 1 blocked give (6 − 1 − 1) ÷ 10 = 40%.
Distribution
Distribution uses only the sets recorded in the file and the linked attacks, with coverage stated. Targets, combinations and actual zones are shown separately. The file's F and B markers are read as Front and Back: they aren't automatically turned into position 4, position 2, outside or opposite.
Serve and reception
You'll find serve and reception outcomes and samples, the zones recognised in the file and serve-reception pairs when the link between the two actions is reliable. The court is drawn in volleyball colours and each map also has a text description. Directions recorded as cones aren't converted into zones.
Score flow and runs
The per-set chart shows the score flow, the margin and runs of consecutive points, with rally detail. You can change the thresholds that define the end of a set. If rallies are missing from the file, the chart shows the gap: it doesn't join the points by inventing continuity.
Samples, coverage and older imports
For each source and section you'll find coverage: how many actions were used, which were excluded and why, and unrecognised rows you can inspect. A partial file, for example an extract that stops mid-set, is declared as such.
VCC reads the codes it recognises and stores. A .dvw file may contain information the analysis doesn't use: coverage exists precisely so you can see what was considered. When two sources describe the same game, the associated .dvw file prevails and the live box score is neither added nor used to fill missing data. Opponents with the same name in different files aren't merged automatically.
Private notes and linking to a session
When a data point is useful for training, save it as a note:
- Create a note in the analysis: the metric, the sample and the selected matches are stored with the text.
- Write what you noticed and the goal, e.g. "Low side-out in P1: work on reception in zone 1".
- Optionally link the note to one of your sessions in Practice planning: you'll find it in a collapsible section while preparing exercises.
Who sees what
- Coach and staff see team analyses according to the roles set up for the team.
- Athletes only see their own data.
- Supporters and unrecognised roles don't have access.